Road Accident Analysis (England)
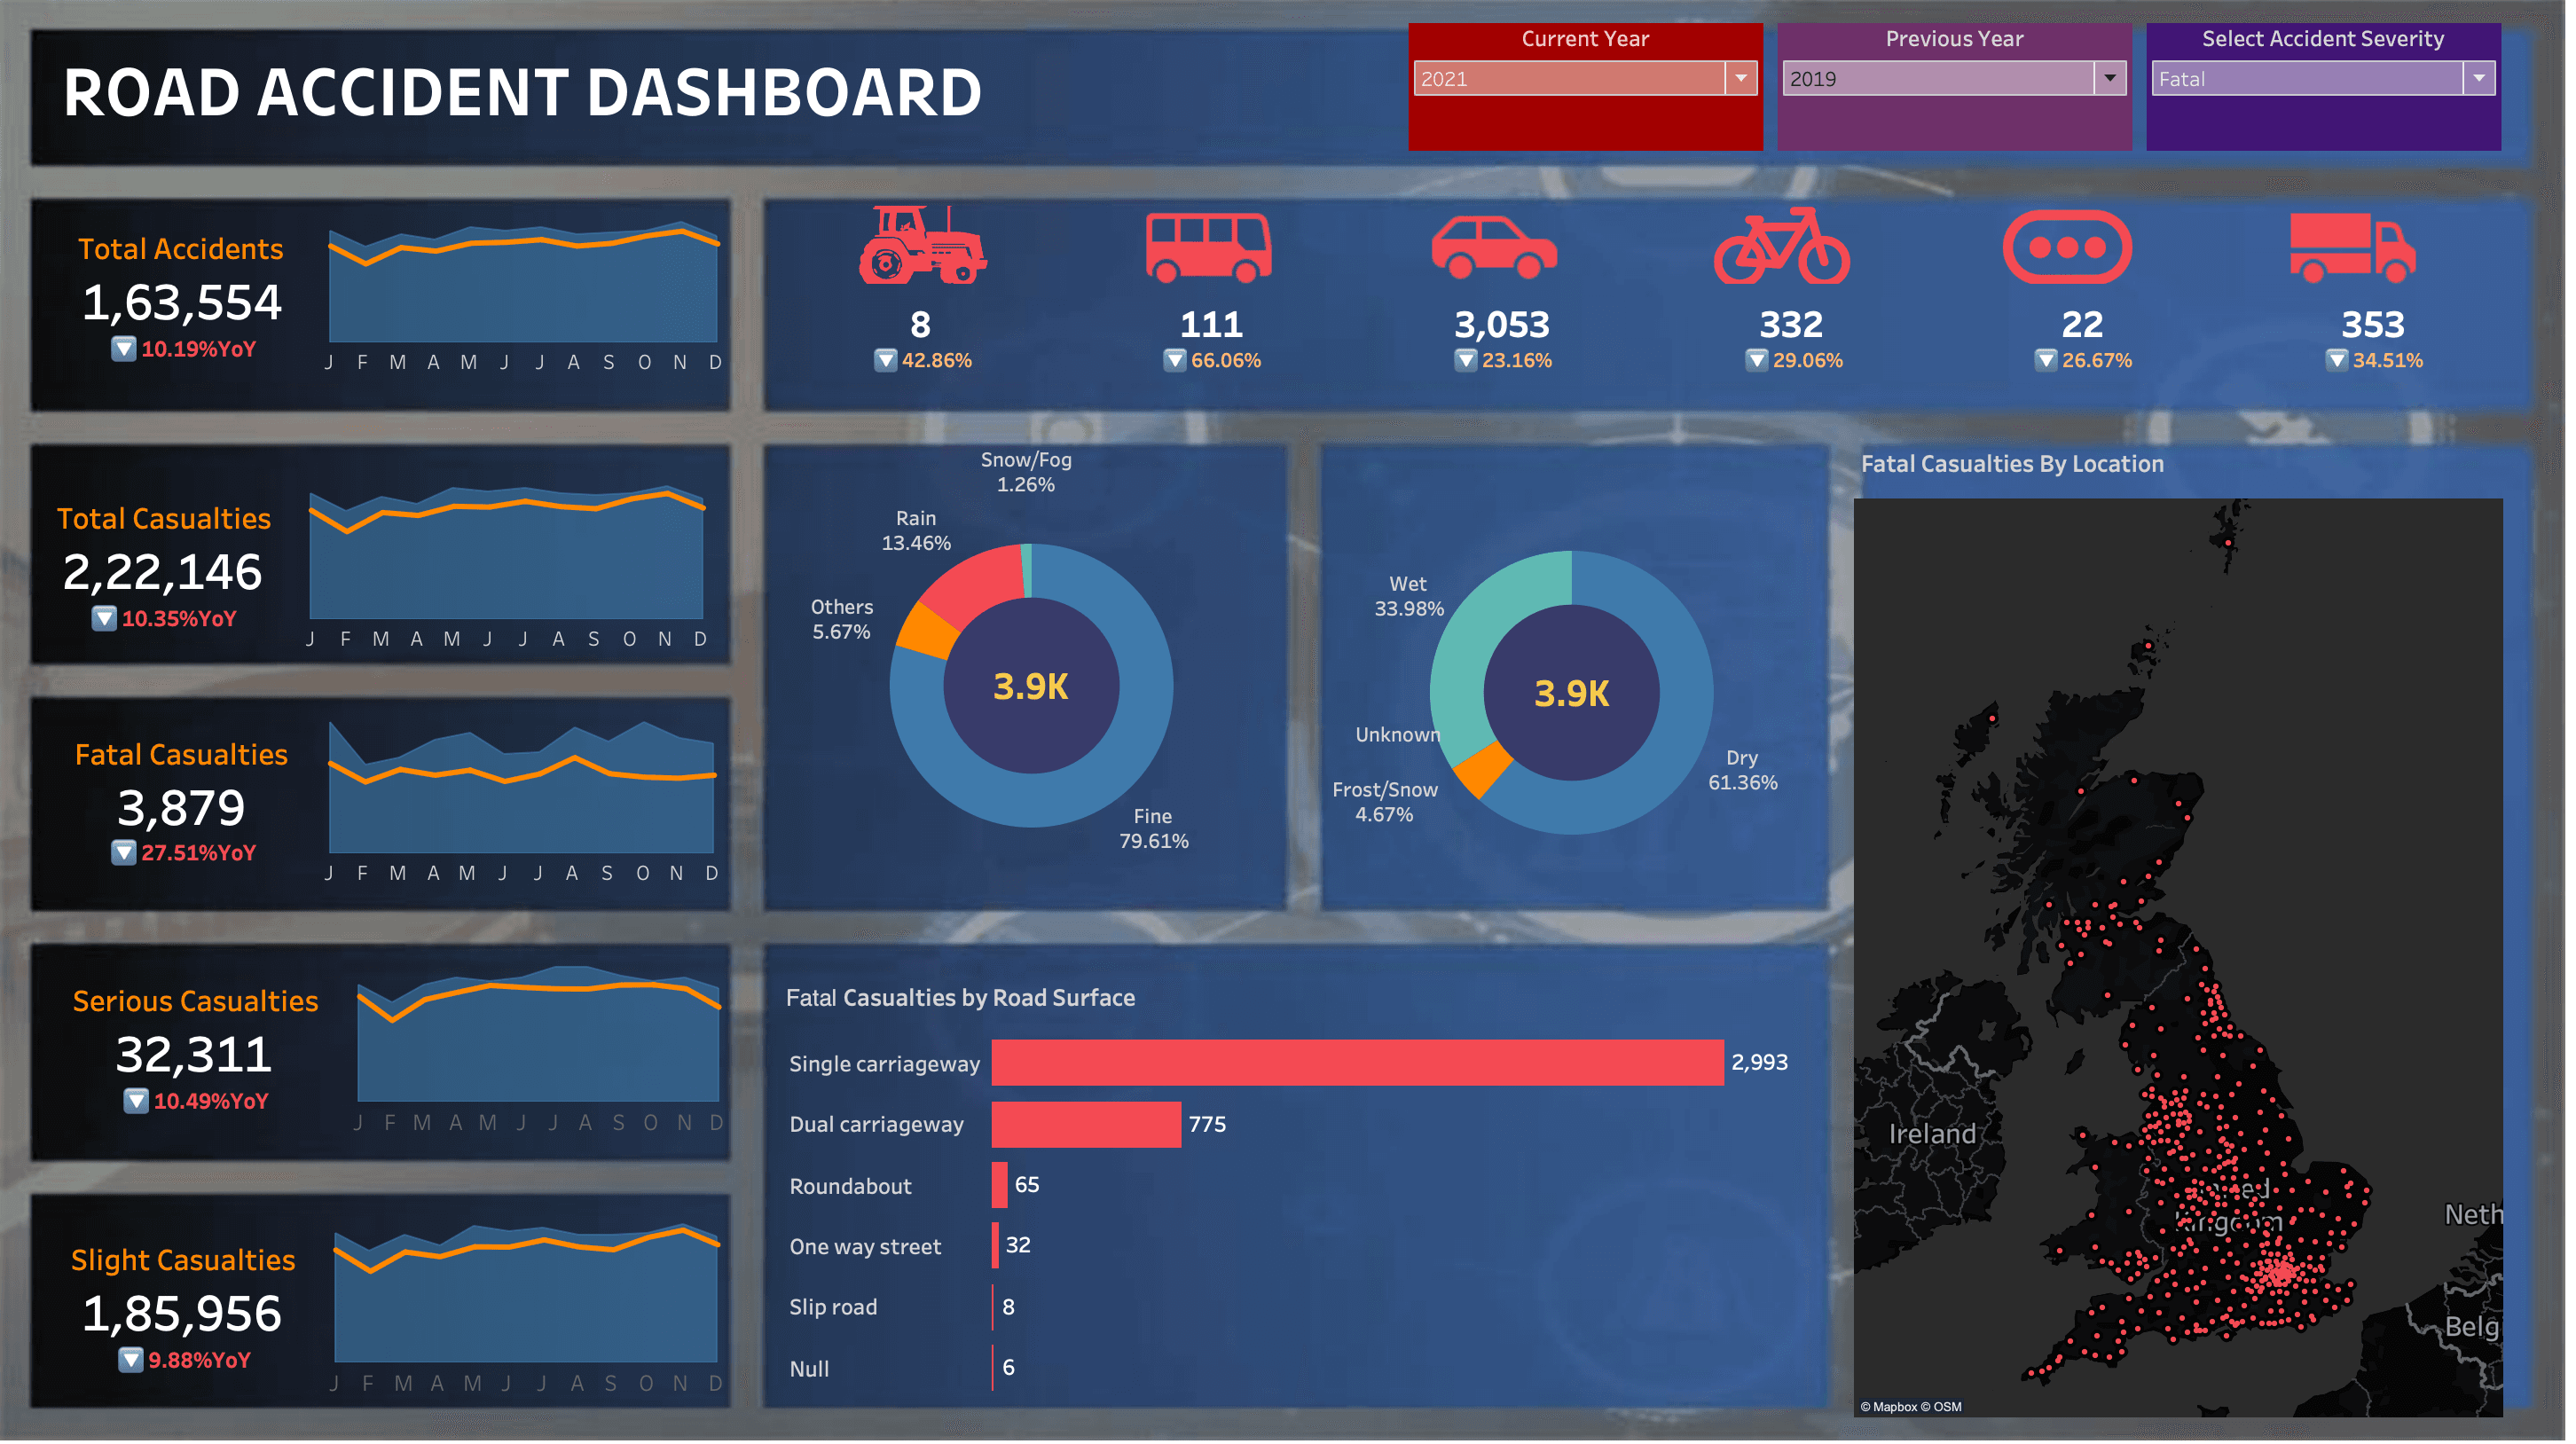
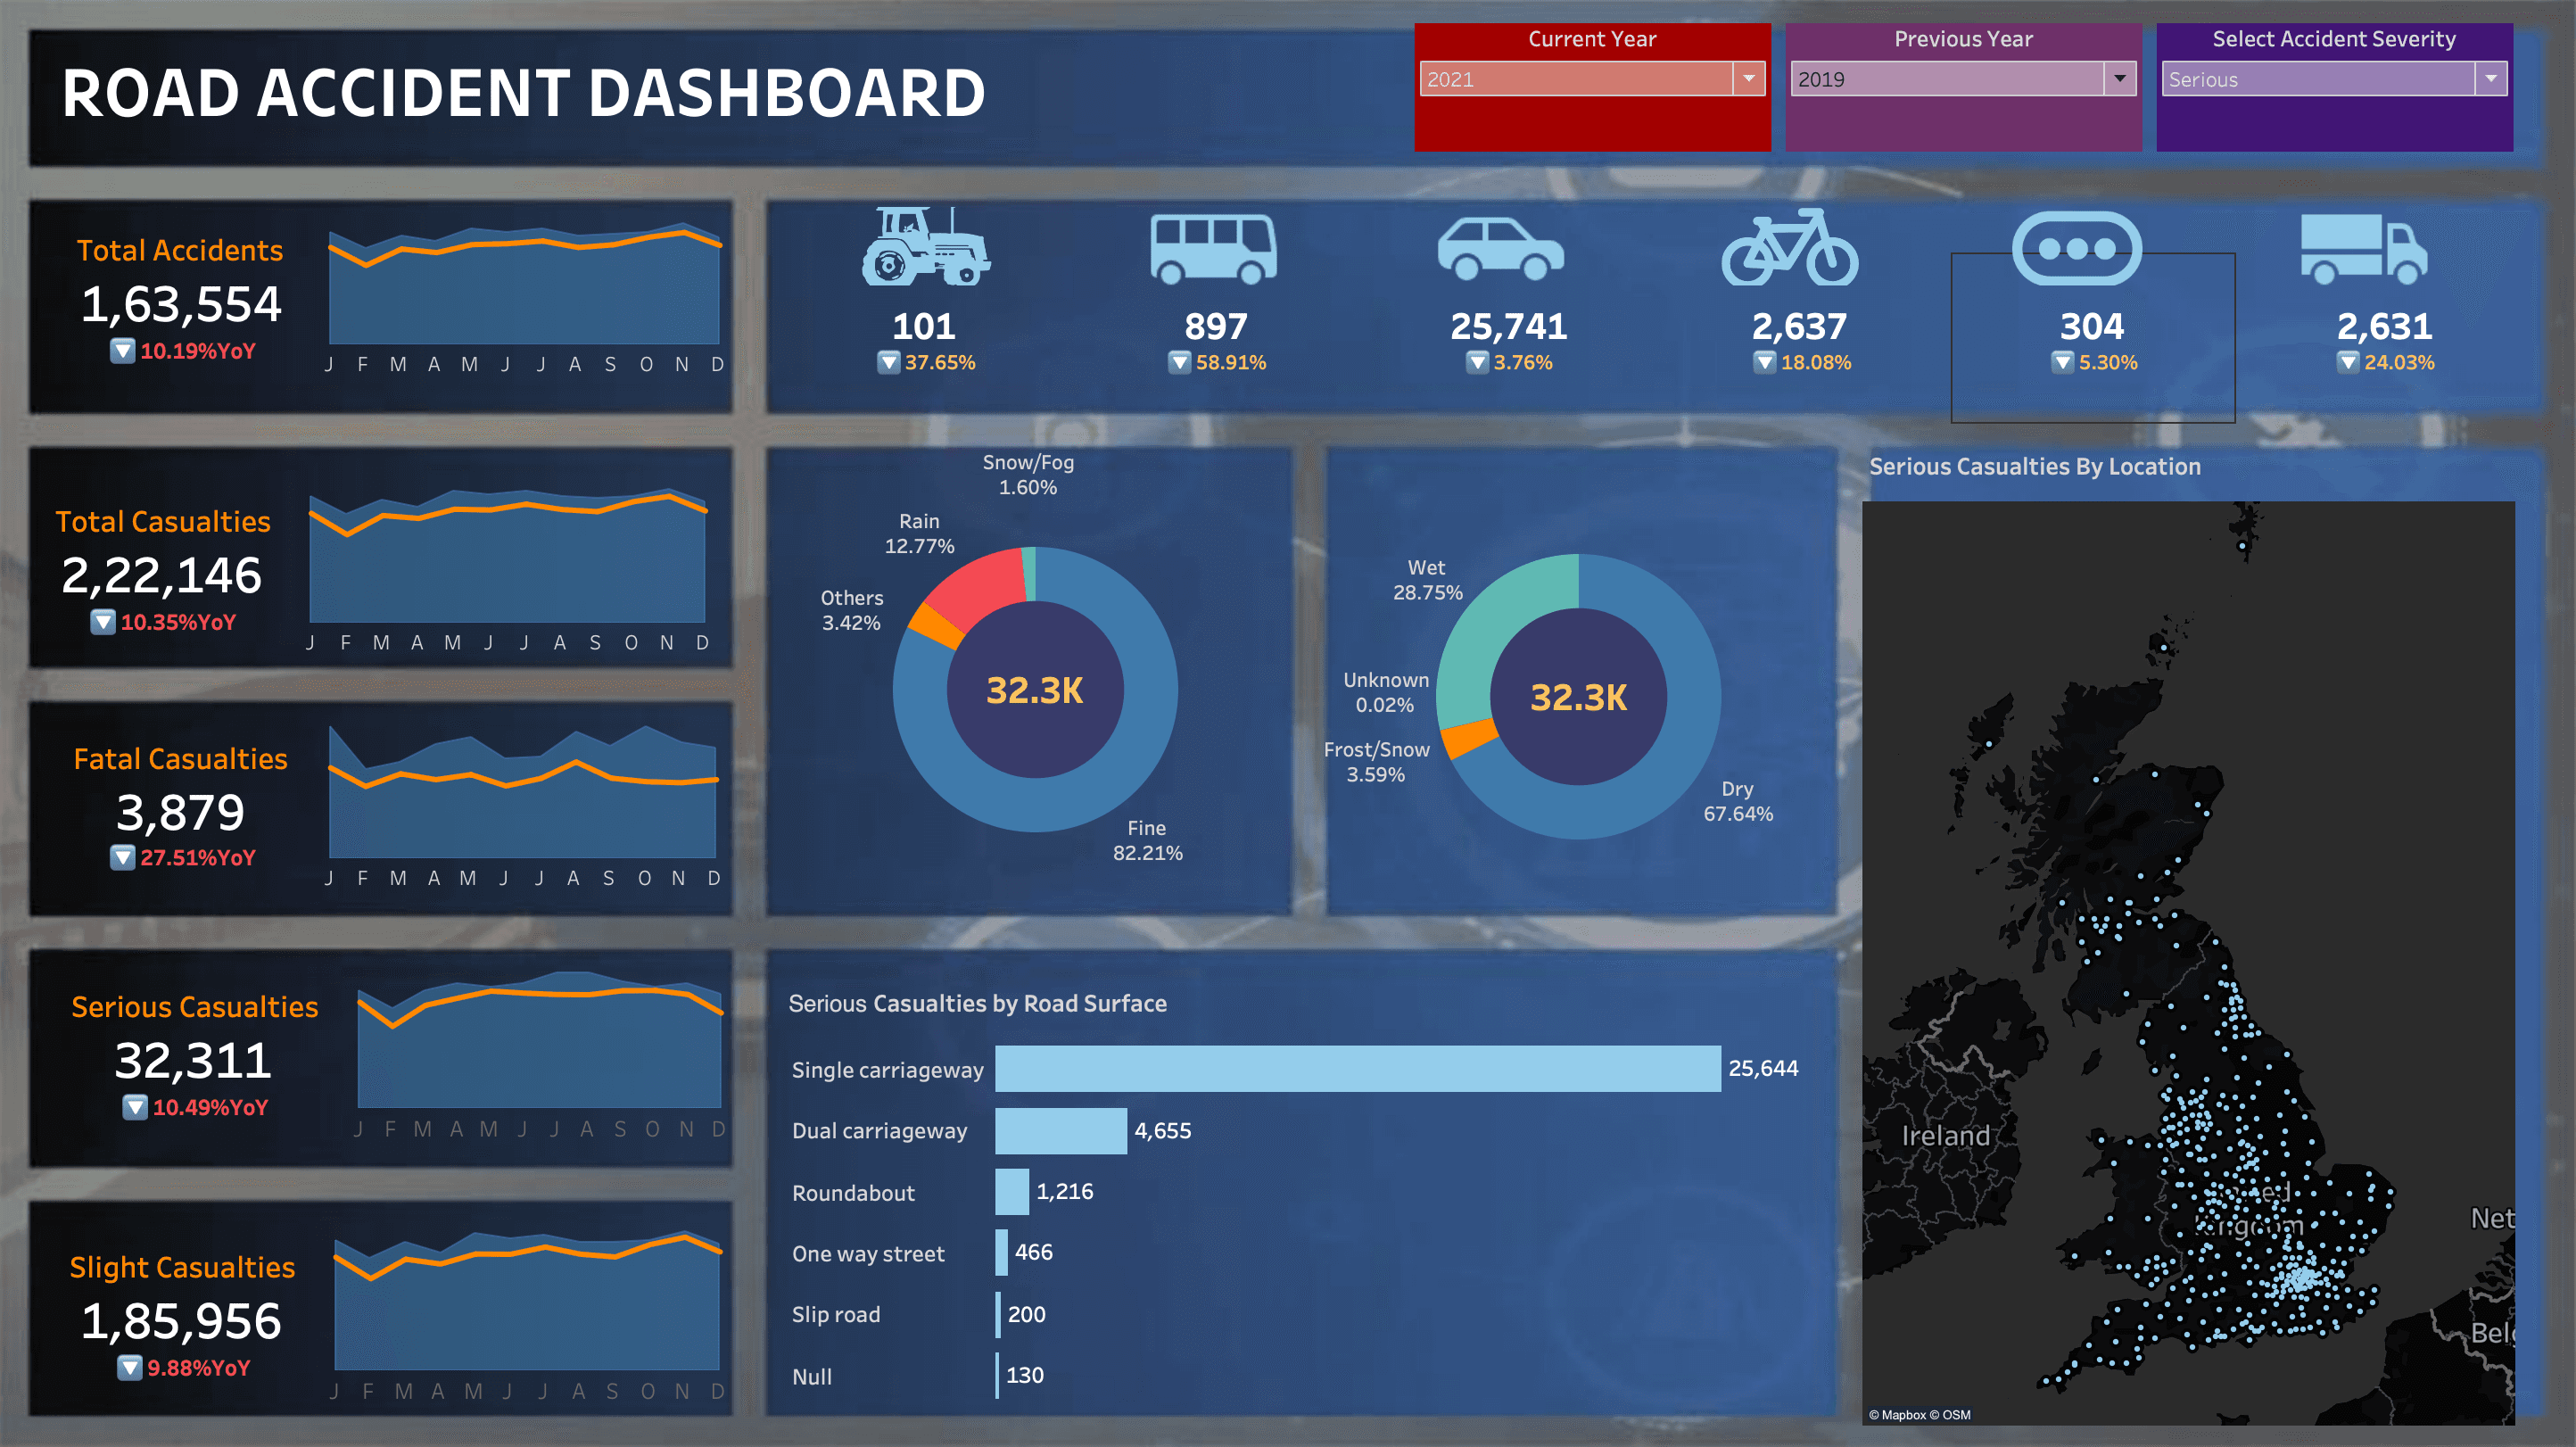
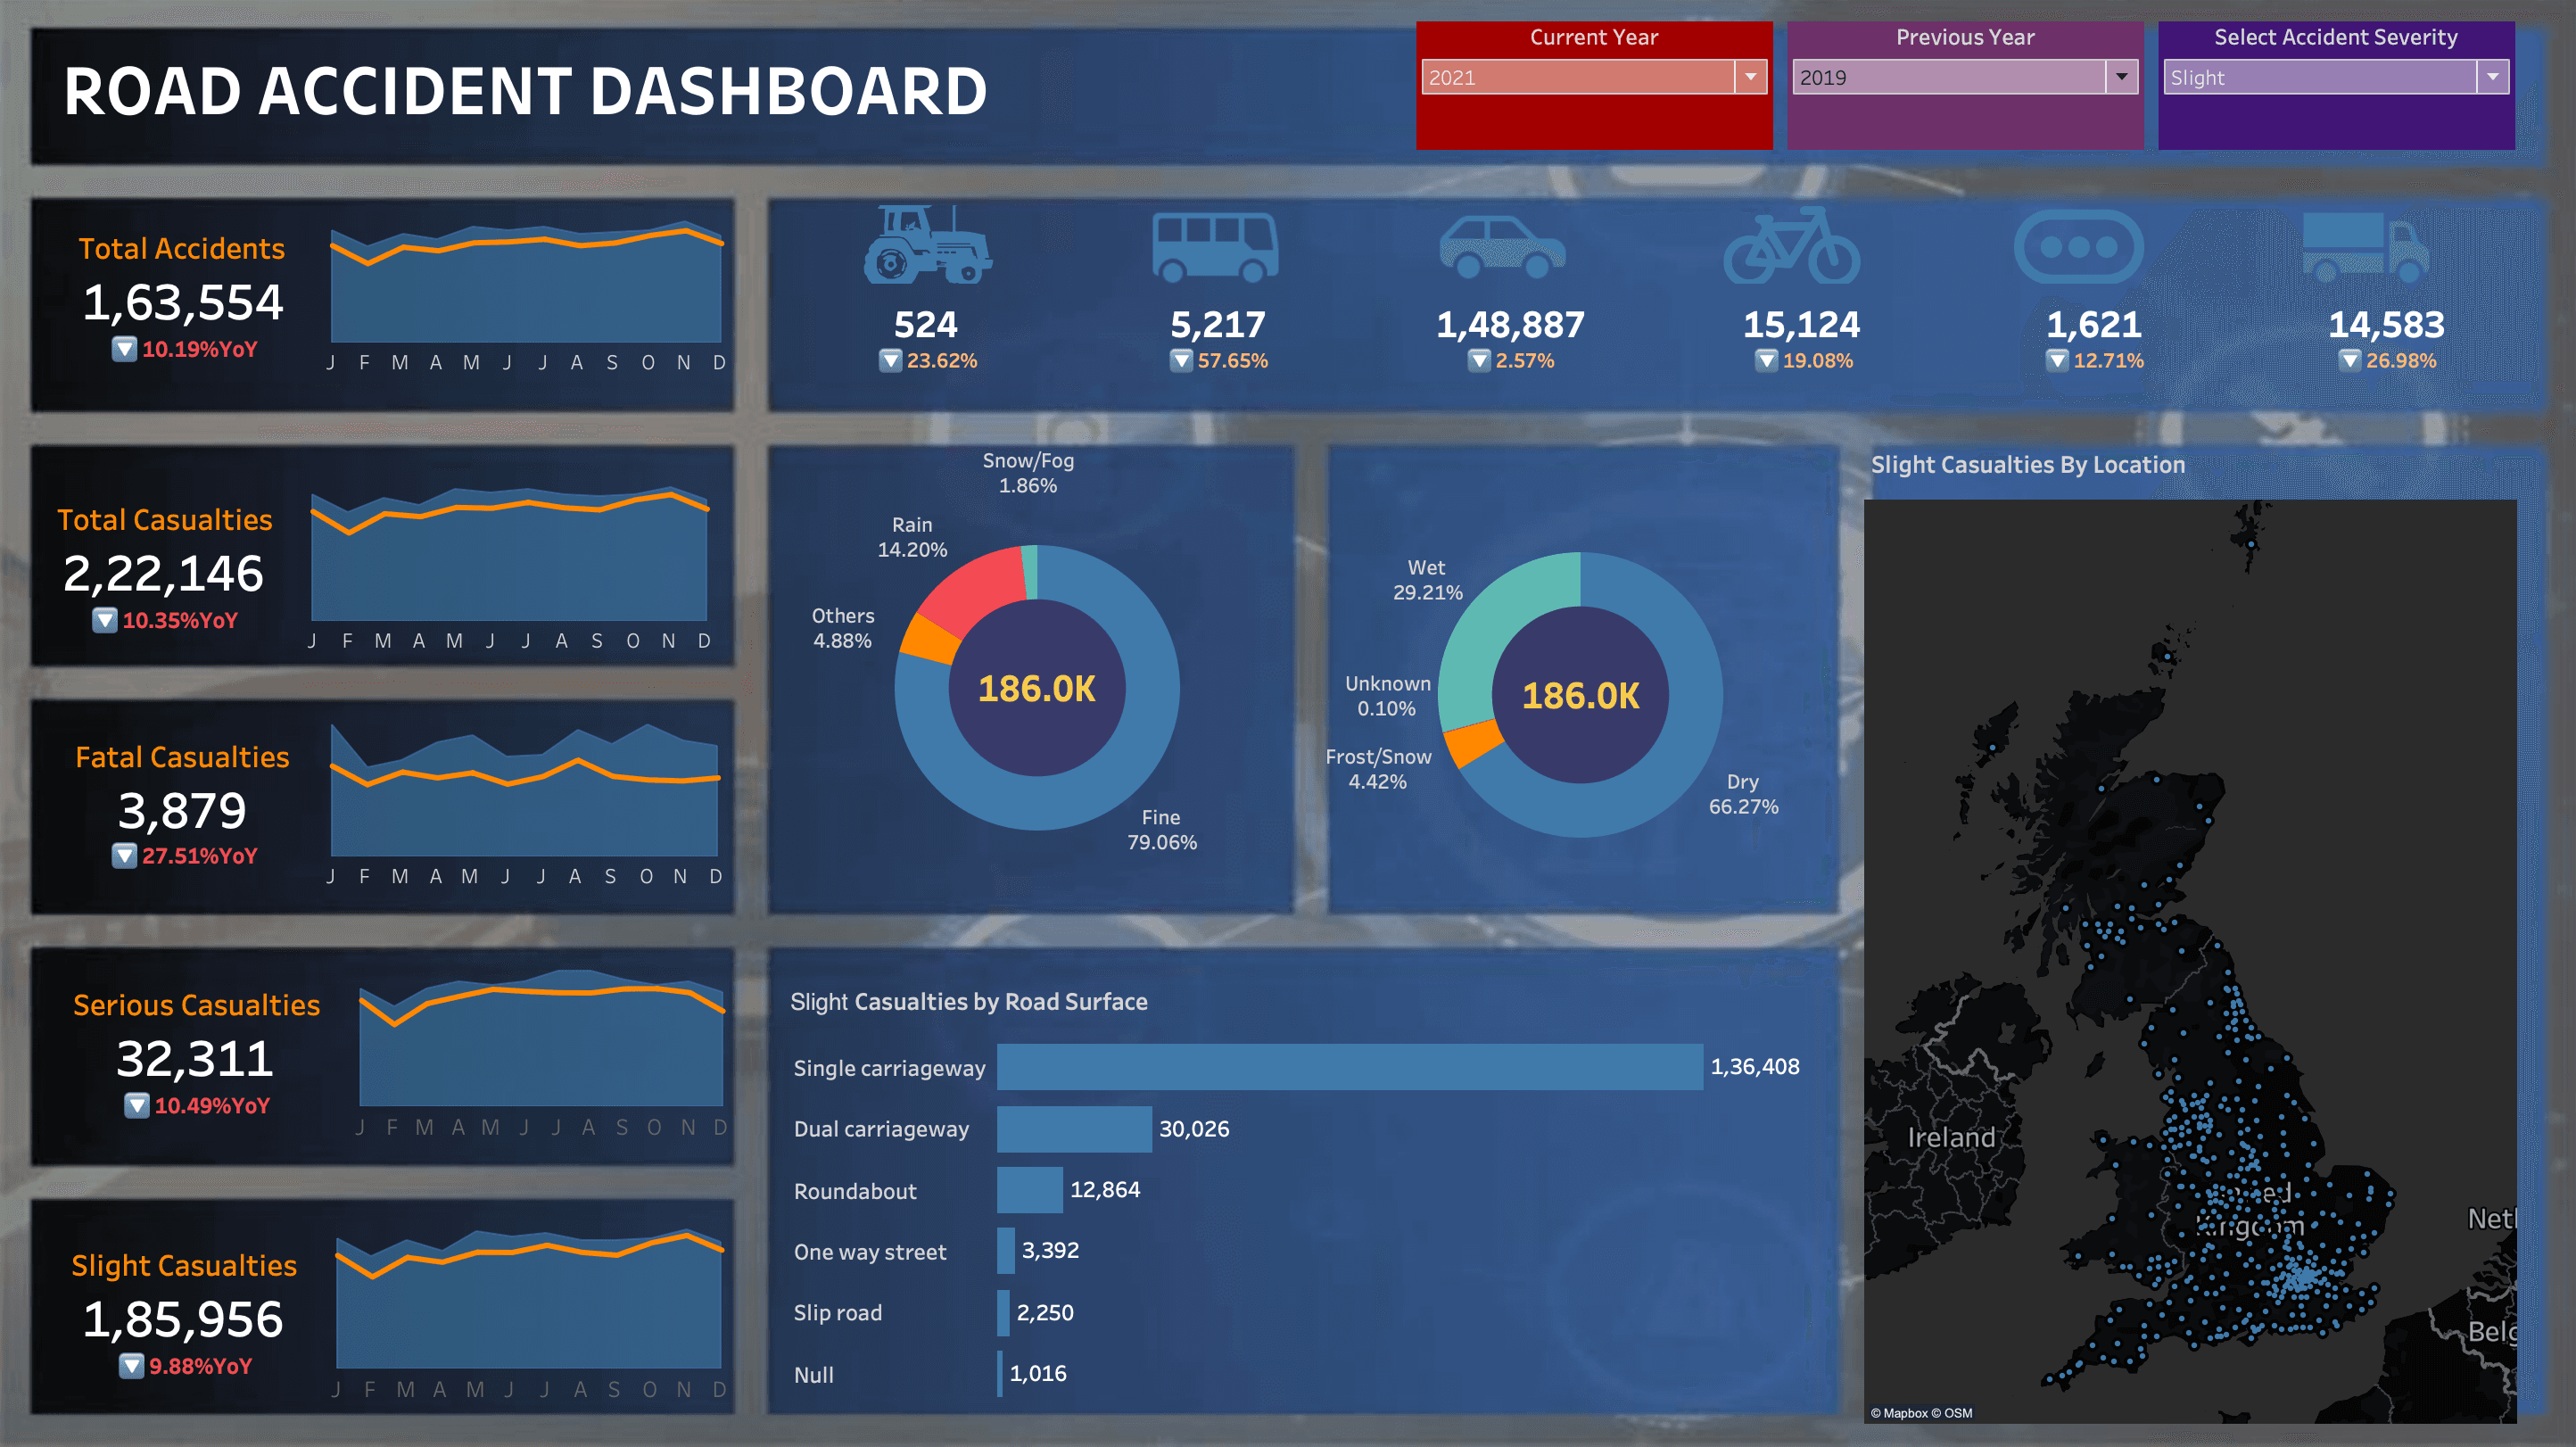
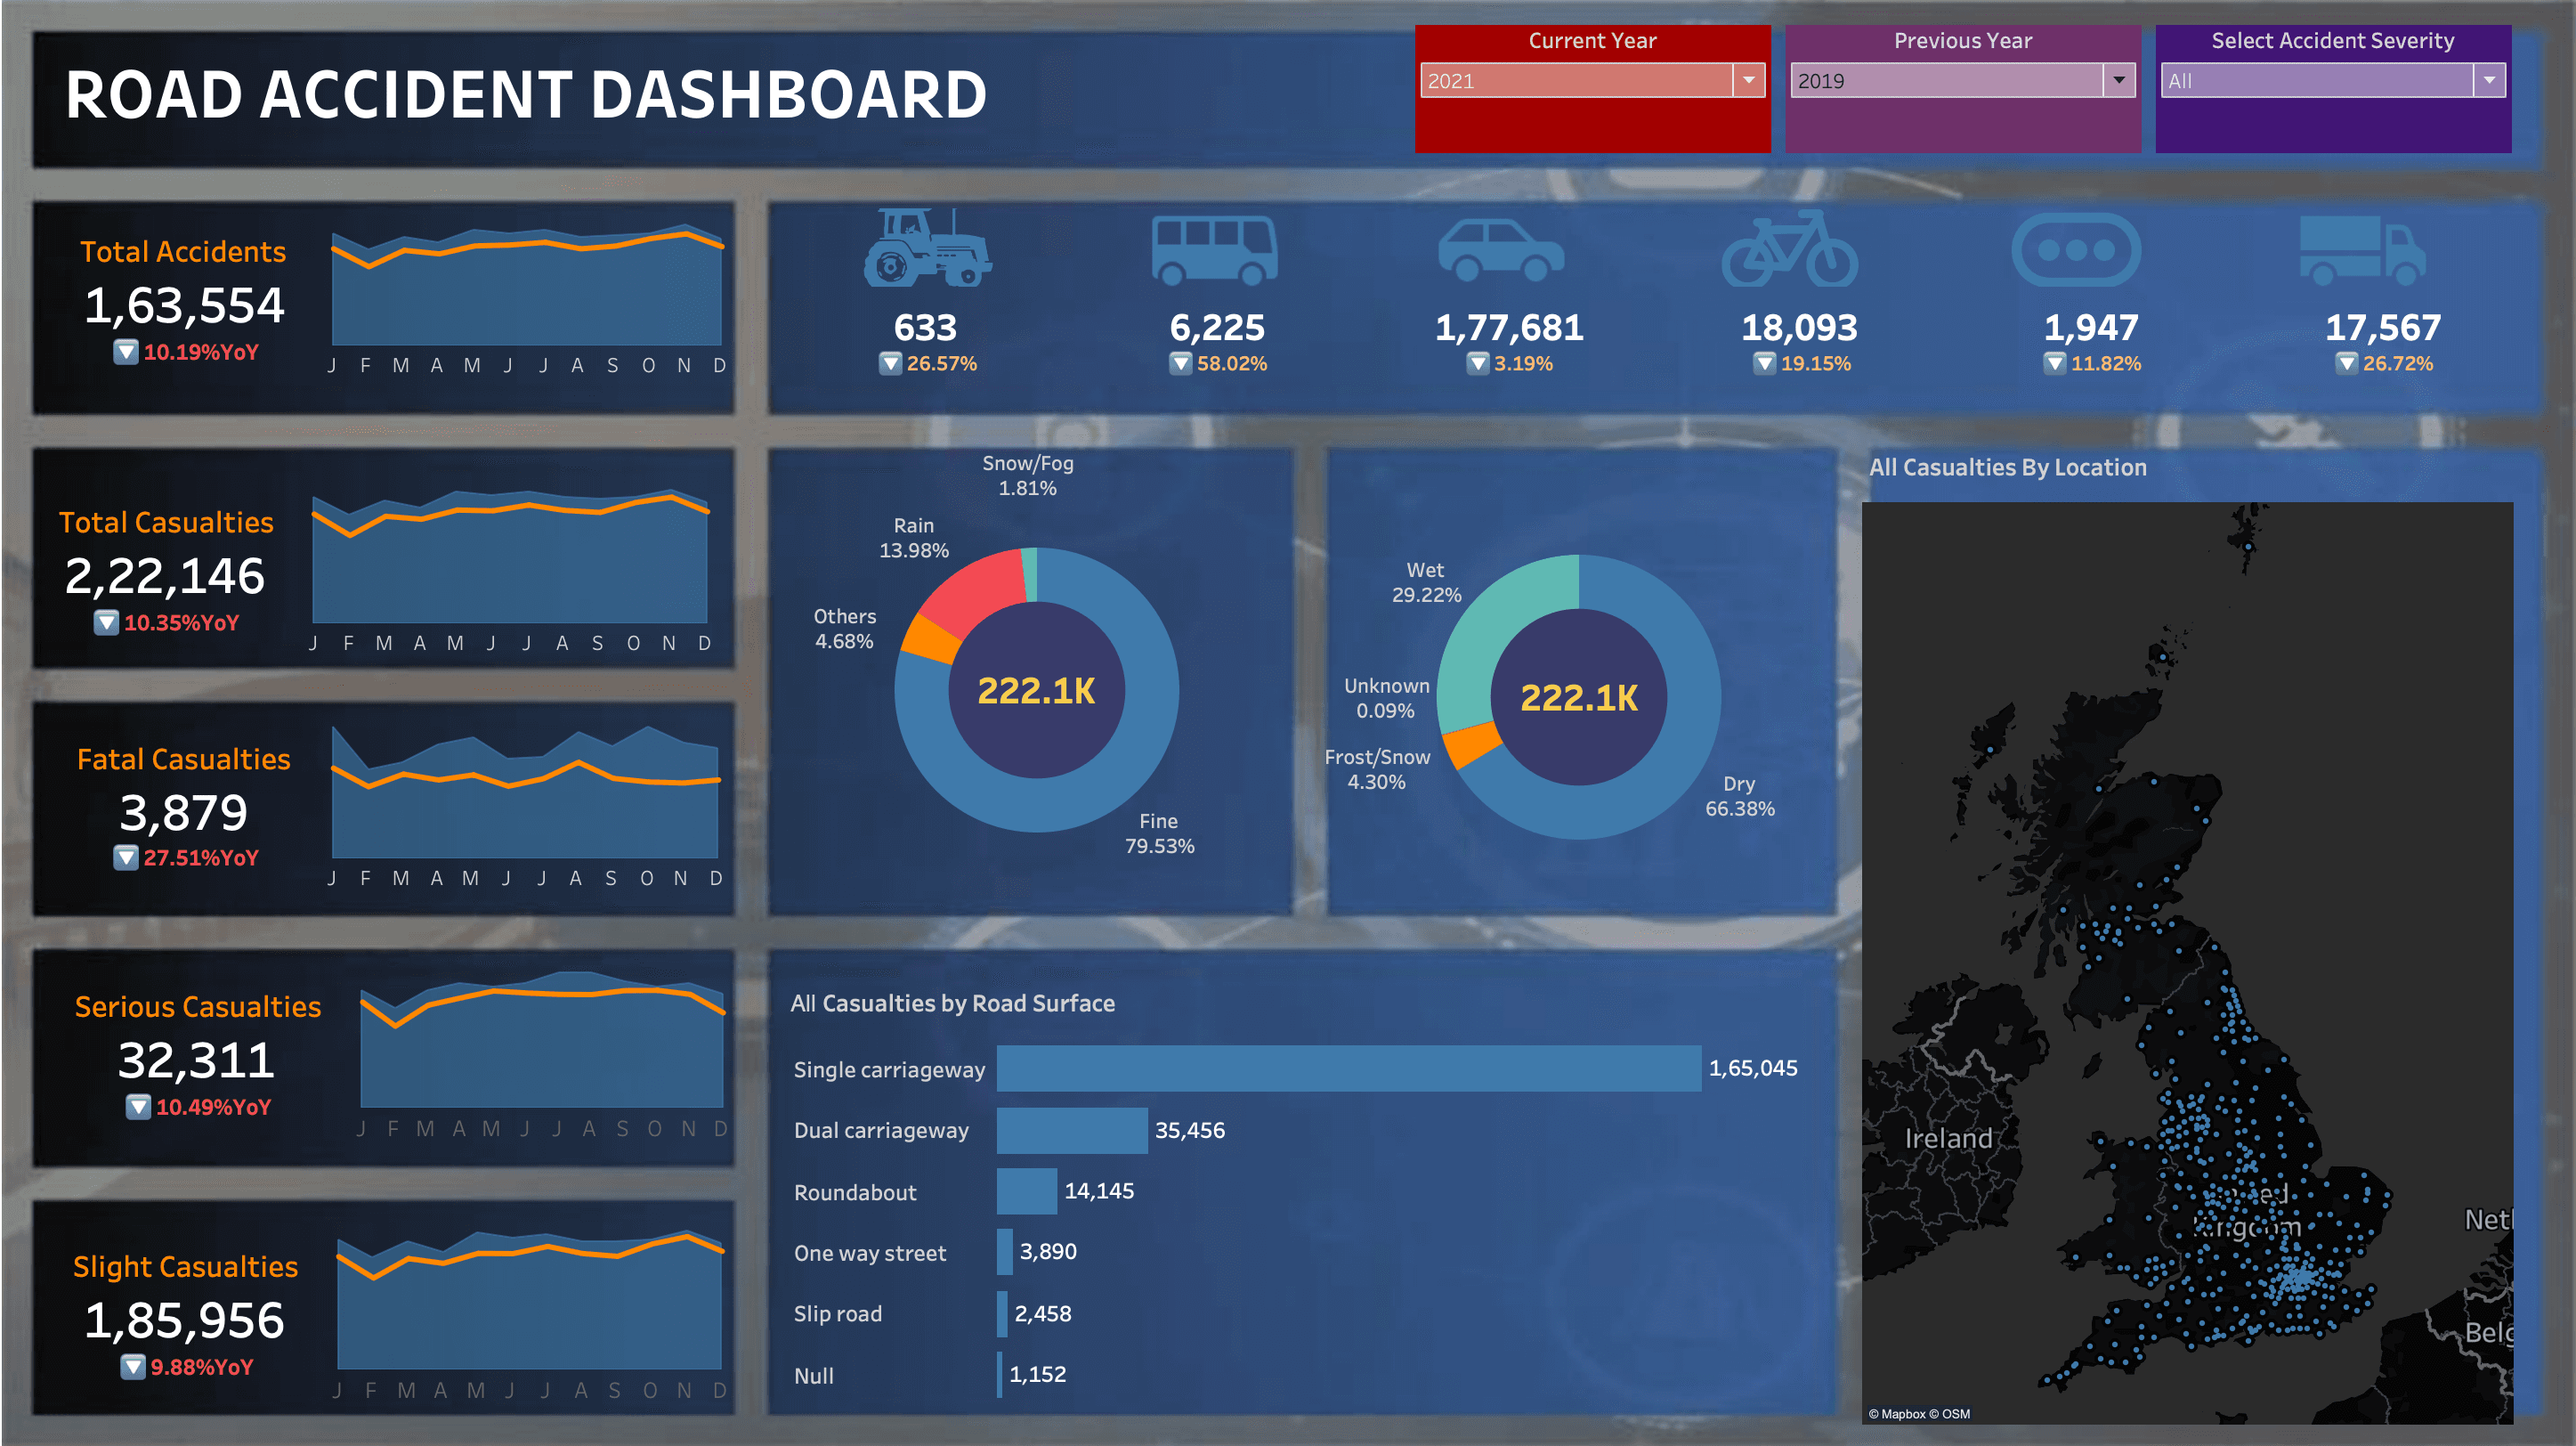
A fully interactive Power BI and Tableau-based dashboard analyzing road accidents in England from 2019 to 2024. The dashboards allow users to filter by year, accident severity (fatal, serious, slight), vehicle type, and location to explore patterns, hotspots, and risk factors. The screenshots shown below represent sample filtered views from the full interactive system.
Project Overview
This project analyzes large-scale UK road accident data to understand how accident severity varies across geography, road types, weather conditions, and vehicle categories. The goal is to identify high-risk zones and conditions so that data can support road-safety planning and infrastructure decisions.
Dashboard Capabilities
- Analyze accident trends from 2019 to 2024
- Filter by accident severity: Fatal, Serious, Slight, or All
- Compare year-over-year changes in casualties
- Explore geospatial accident hotspots across England
- Study how road type, surface, and weather affect accident risk
Dashboards by Accident Severity
Fatal Accidents
Serious Accidents
Slight Accidents
All Accidents
Real-World Impact
This dashboard can be used by transport authorities, city planners, and public safety teams to identify high-risk roads, accident hotspots, and dangerous driving conditions. By visualizing accident severity, location, road type, and weather patterns, decision-makers can prioritize infrastructure improvements, deploy traffic enforcement more effectively, and design targeted road-safety campaigns to reduce fatalities and serious injuries.